

From Utilization Graphs to Real Insight: What Customer Facing Network Visibility Should Look Like
Most customer portals show how much traffic is flowing. The real value comes from understanding what that traffic is, where it's going, and why.

When a network operator recently moved one of their partners from a Tier 1 only transit setup to include a Tier 2 provider, the expected win was routing performance. Most traffic shifted to shorter, lower latency paths almost immediately. But what the operator did not expect to write about publicly was this:
“The bigger surprise was the portal.”
Specifically, flow visibility without needing to run a separate flow analyser. A single pane of glass across all services. Provisioning that used to take days compressed into under an hour.
You can read the original post here. It is what prompted us to investigate something worth examining. Most operators compete on network quality, price, and coverage. Very few compete on what they give customers the ability to see. For the engineers actually running infrastructure on top of your network, visibility is not a nice to have but is the difference between being able to do their job independently or depending on you for every question.
The Gap Inter.link Set Out to Close
Inter.link already had strong internal visibility into their own network through BENOCS traffic flow analytics. The question was what their customers could actually see, and the answer was not much beyond standard utilization graphs.
Utilization data only tells you how much traffic is moving. It says nothing about what that traffic is, where it is going, or why it is routing the way it is. For a customer trying to understand a routing change, troubleshoot a performance issue, or simply validate that their traffic is behaving as expected, that gap creates friction. Every question that cannot be answered by self-serve becomes a support interaction.
Inter.link integrated BENOCS directly into their customer portal to close that gap, giving customers access to the same quality of network intelligence that their own engineering team relies on, scoped specifically to each customer’s traffic.
What Meaningful Visibility Actually Includes
There are distinct layers to network visibility, and most customer portals stop at the first one. Here is what each layer actually gives a customer:
Utilization data tells you how much traffic is flowing across which interfaces. Essential, but blunt. It tells you that something is happening, not what.
Flow data shows what traffic is flowing, which source ASNs are sending to which destination ASNs, and how that composition shifts over time. This is where customers start to understand their traffic rather than just measure it. Most customers do not run their own flow analyzers. Providing this layer gives them a capability they likely do not have anywhere else.
Routing context explains why. How BGP decisions are affecting traffic distribution, which peers and upstreams are carrying what traffic, and how routing changes shift flows in practice.
Together, these layers let a customer answer questions they previously had to escalate, such as:
Where is my traffic going?
Why did my routing change yesterday?
How much of my traffic is going via which peer?
These are not exotic questions. They are the everyday operational questions that a good visibility layer should make straightforward to answer.
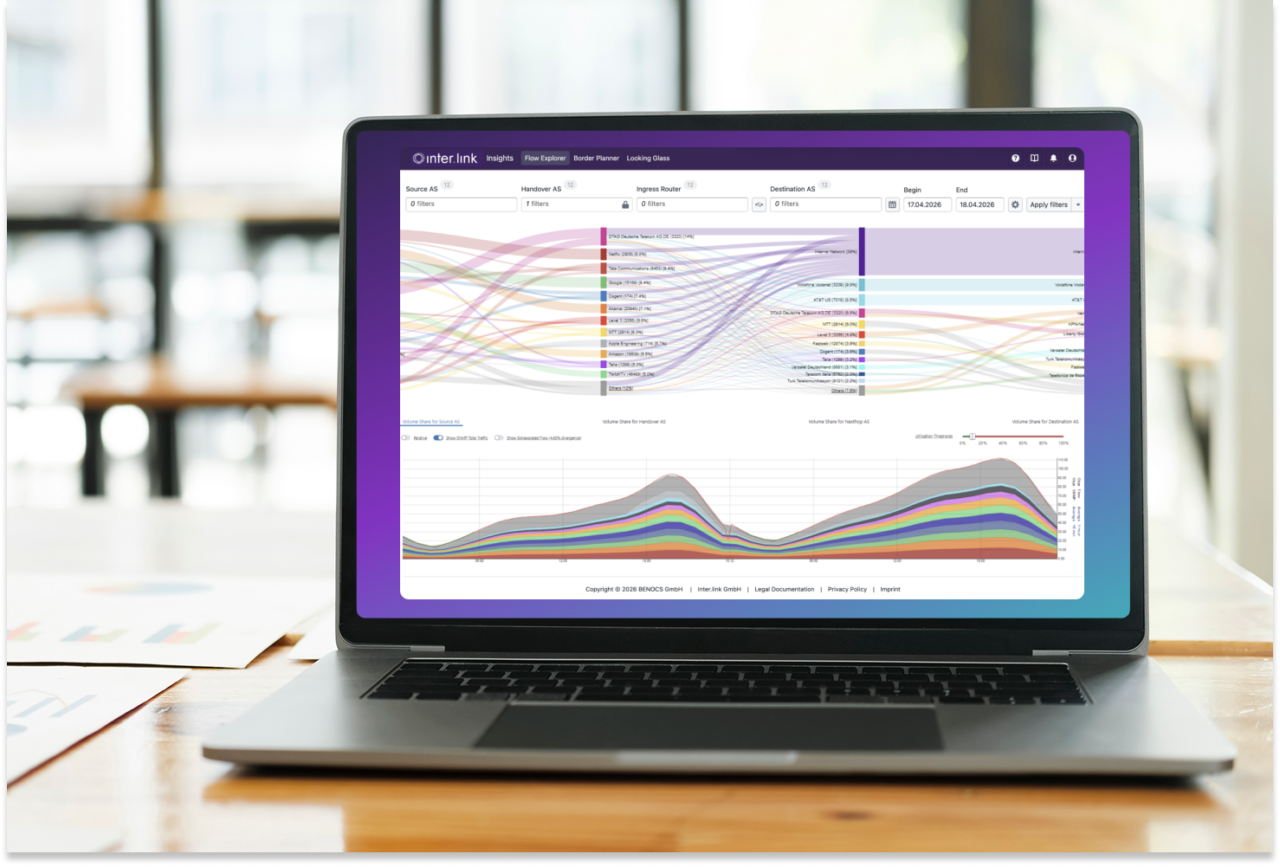
How the Integration Works in Practice
The technical foundation involves correlating four inputs continuously:
Underlay topology
BGP routing data
Sampled flow telemetry
Interface utilization metrics
When combined, these give a complete picture of how traffic is moving through the network and why. Each customer sees only their own traffic. Filtering by AS number means the view is scoped entirely to their network’s presence in the Inter.link network.
A few implementation details that turn out to matter more than expected:
Seamless login. The Inter.link portal acts as the identity provider and passes the relevant AS number to the visibility layer automatically. There is no separate login, no onboarding friction, and no reason not to use it. Adoption follows access.
Shareable URLs for specific queries. When a customer spots an unusual traffic pattern and wants to discuss it with their account manager, a persistent URL for that exact query changes the quality of the conversation entirely. Both sides are looking at the same data, in real time, without exchanging screenshots or trying to recreate a view over a call.
A fully branded environment. The visibility tooling appears as a native part of the Inter.link portal rather than a third-party product alongside it. That consistency matters how customers experience the service.
This model is not exclusive to transit providers. Any operator offering connectivity to enterprise or wholesale customers faces the same underlying challenge: customers want to understand how their traffic is behaving on your network, not just how much of it there is. When visibility is built into the service rather than treated as an optional extra, it shifts the relationship from reactive support towards more substantive conversations about routing decisions, peering strategy, and capacity. It is also a trust signal.
Why This Matters in the Current Climate
European network operators are increasingly focused on where their intelligence comes from, and this includes not only connectivity but also the data and routing insights that inform how networks are managed. Relying on non-European sources for operational network intelligence carries real risk, whether regulatory, reputational or operational.
This is part of what the Connectivity Insight Initiative endeavors to address. By combining European IP infrastructure with network analytics, the goal is to make practical insights about traffic patterns, routing behavior, and interconnection dynamics available to the broader network community